
We develop a 3-D model of the seismic anisotropy in the upper mantle under Central Europe. This model should improve the understanding of recent an past geological and geodynamic processes like asthenospheric mantle flow and lithospheric deformation. We use the measurement of shear-wave splitting of core phases (mainly SKS- and SKKS-phases) and numerical simulation of 3-D wave field propagation.
The S-wave-splitting measurements are done with long-term recordings (> 20 years) of (semi-) permanent broadband stations in the area of the Upper Rhine Graben area (Fig. 1). The determined splitting parameters (fast polarization direction relative to the north ϕ and delay time δt) show backazimuthal variations at the single stations as well as lateral variations between the stations (Fig.2). Such variations are clear signs for vertical and also (small-scale) lateral variations of the seismic anisotropy, e.g. between the east side and the west side of the Upper Rhine Graben as well as between the Moldanubian Zone in the south and the Saxothuringian Zone in the north.
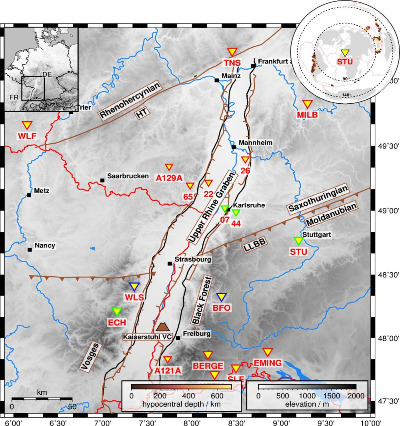
Fig. 1. Region of the Upper Rhine Graben with (semi-) permanent seismological recording stations (invers triangles), colours depending on work progress. The brown lines indicate tectonic borders, e.g. between the Moldanubian Zone, the Saxothuringian Zone and the Rhenohercynian Zone. The insert in the upper right corner shows the distribution of analysed earthquakes.
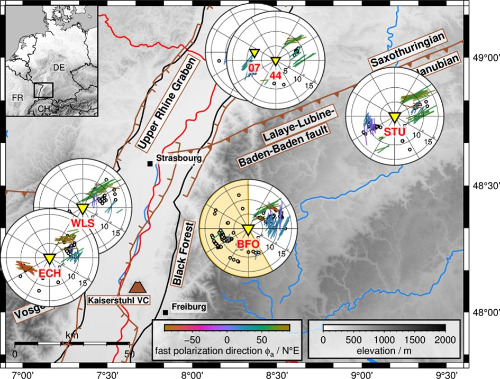
Fig. 2. Visualisation of the first S-wave-splitting measurements as stereoplots. Splits are visualized as bars, which are orientated and coloured according to the fast polarization direction relative to north ϕ and its length is proportional to the delay time δt. Black outlined white points represent null splits. The variations indicate complex anisotropy at depth.